目录
- 什么是思维导图?
- F6中如何绘制
- 支付宝中
- 微信中
- 总结
什么是思维导图?
思维导图(英语:mind map),又称脑图、心智地图、头脑风暴图、心智图、灵感触发图、概念地图、或思维地图,是一种用图像整理信息的图解。它用一个中央关键词或想法以辐射线形连接所有的代表字词、想法、任务或其它关联项目。它可以利用不同的方式去表现人们的想法,如引题式、可见形象化式、建构系统式和分类式。它普遍地用作在研究、组织、解决问题和政策制定中。《维基百科》
思维导图是由英国的托尼·博赞于1970年代提出的一种辅助思考工具。以目标主题为中心节点不断向外延展关联,不断分解和探索,最终形成一张完整的树状图。从具体的操作过程来看,也可以理解为对探索过程的可视化,完整记录了每一次关联的结果。这种形式更加符合人的思考方式,最后的图也让我们对主题更有体感和整体的了解。

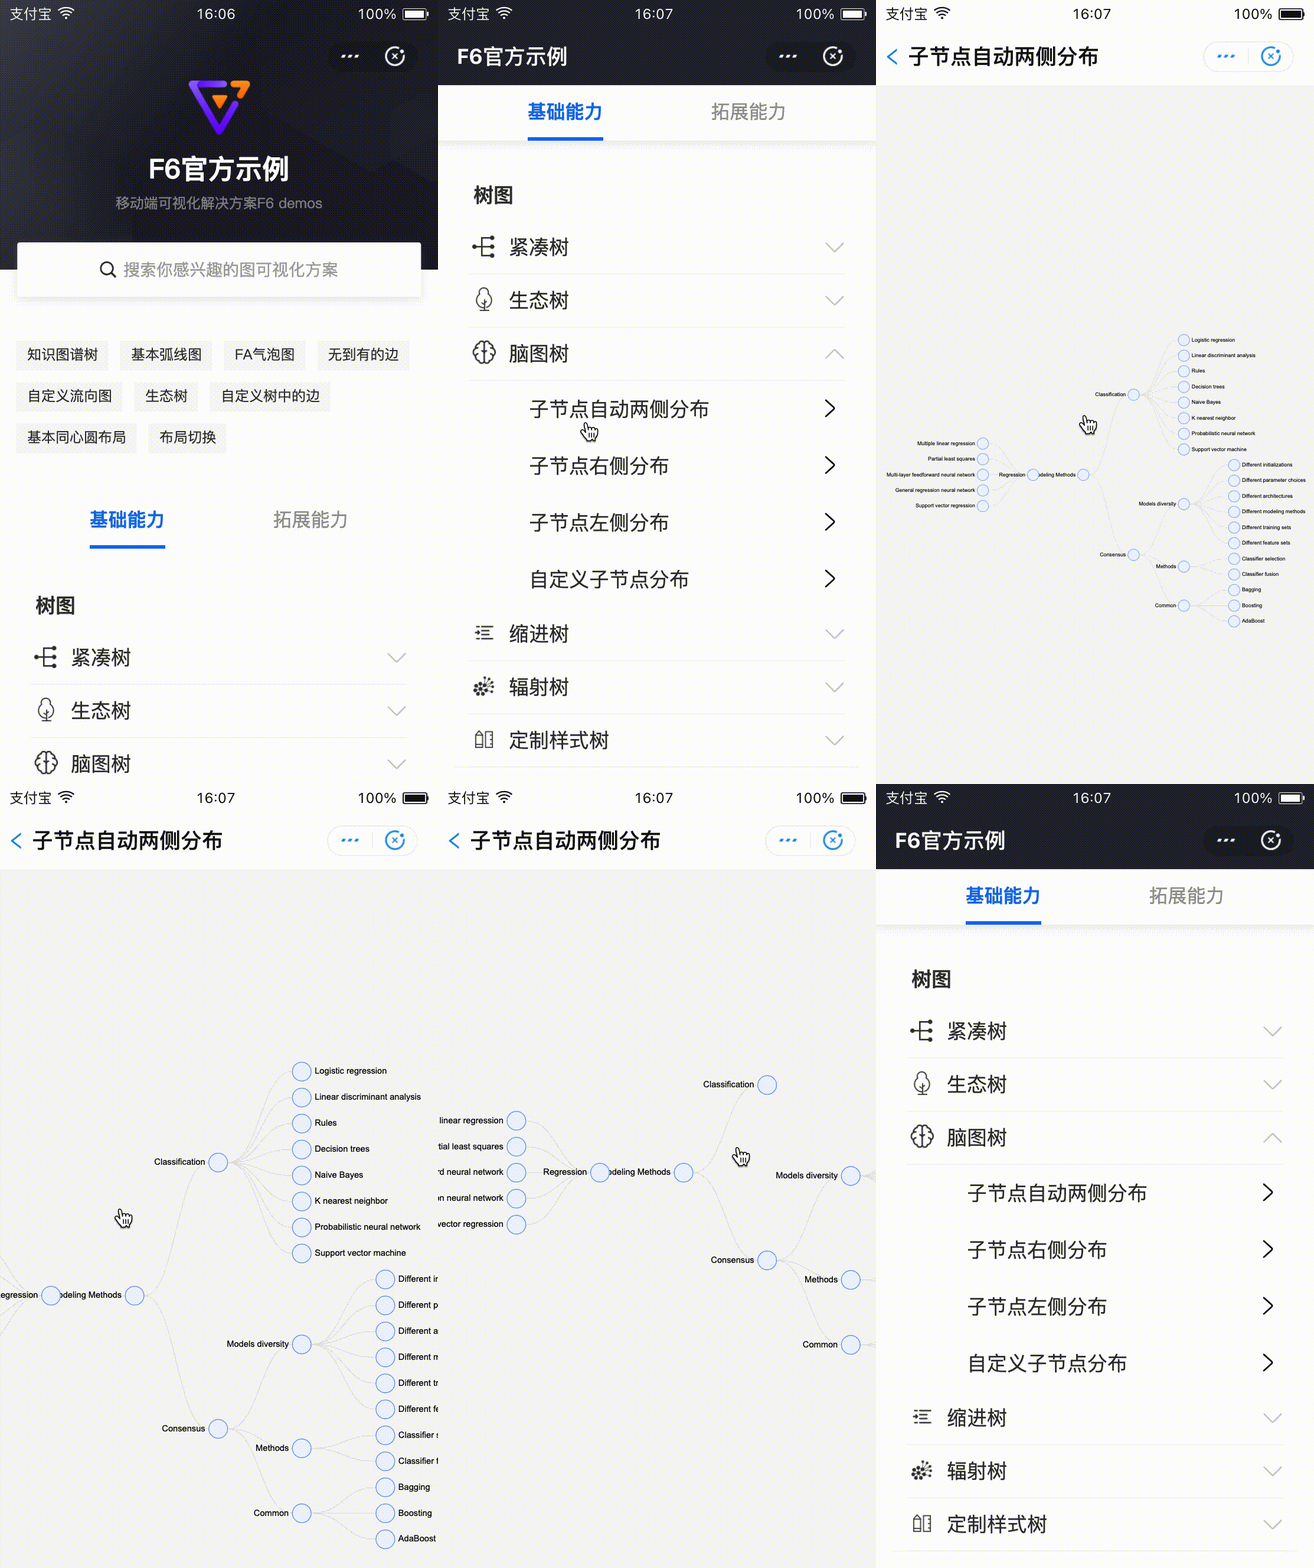
正因为思维导图的关注点在于思考,而我们的正常活动离不开思考,所以思维导图有非常广泛的使用场景。比如总结归纳、报告演示、头脑风暴等。实施起来只需要纸笔足以,当然也有丰富的在线、独立应用可以支持到图的制作。如果我们的产品需要展示围绕一个主题的多层关联信息的时候,便可以采用思维导图的形式。F6可以很方便地在小程序中绘制脑图,比如上图的效果,有相关需求的同学值得一试。
F6中如何绘制
演示示例可以参考f6.antv.vision/zh/docs/exa…
本节代码已经开源,感兴趣可以查看
支付宝 github.com/antvis/F6/t…
微信 github.com/antvis/F6/t…
支付宝中
首先安装
npm install @antv/f6 @antv/f6-alipay -S
data.js
export default {
  id: 'Modeling Methods',
  children: [
    {
      id: 'Classification',
      children: [
        {
          id: 'Logistic regression',
        },
        {
          id: 'Linear discriminant analysis',
        },
        {
          id: 'Rules',
        },
        {
          id: 'Decision trees',
        },
        {
          id: 'Naive Bayes',
        },
        {
          id: 'K nearest neighbor',
        },
        {
          id: 'Probabilistic neural network',
        },
        {
          id: 'Support vector machine',
        },
      ],
    },
    {
      id: 'Consensus',
      children: [
        {
          id: 'Models diversity',
          children: [
            {
              id: 'Different initializations',
            },
            {
              id: 'Different parameter choices',
            },
            {
              id: 'Different architectures',
            },
            {
              id: 'Different modeling methods',
            },
            {
              id: 'Different training sets',
            },
            {
              id: 'Different feature sets',
            },
          ],
        },
        {
          id: 'Methods',
          children: [
            {
              id: 'Classifier selection',
            },
            {
              id: 'Classifier fusion',
            },
          ],
        },
        {
          id: 'Common',
          children: [
            {
              id: 'Bagging',
            },
            {
              id: 'Boosting',
            },
            {
              id: 'AdaBoost',
            },
          ],
        },
      ],
    },
    {
      id: 'Regression',
      children: [
        {
          id: 'Multiple linear regression',
        },
        {
          id: 'Partial least squares',
        },
        {
          id: 'Multi-layer feedforward neural network',
        },
        {
          id: 'General regression neural network',
        },
        {
          id: 'Support vector regression',
        },
      ],
    },
  ],
};
index.json
{
  "defaultTitle": "mindMap",
  "usingComponents": {
    "f6-canvas": "@antv/f6-alipay/es/container/container"
  }
}
index.js
import F6 from '@antv/f6';
import TreeGraph from '@antv/f6/dist/extends/graph/treeGraph';
import { wrapContext } from '../../../common/utils/context';

import data from './data';

/**
 * 脑图-自节点自动两侧分布
 */

Page({
  canvas: null,
  ctx: null,
  renderer: '', // mini、mini-native等,F6需要,标记环境
  isCanvasInit: false, // canvas是否准备好了
  graph: null,

  data: {
    width: 375,
    height: 600,
    pixelRatio: 2,
    forceMini: false,
  },

  onLoad() {
    // 注册自定义树,节点等
    F6.registerGraph('TreeGraph', TreeGraph);

    // 同步获取window的宽高
    const { windowWidth, windowHeight, pixelRatio } = my.getSystemInfoSync();

    this.setData({
      width: windowWidth,
      height: windowHeight,
      pixelRatio,
    });
  },

  /**
   * 初始化cnavas回调,缓存获得的context
   * @param {*} ctx 绘图context
   * @param {*} rect 宽高信息
   * @param {*} canvas canvas对象,在render为mini时为null
   * @param {*} renderer 使用canvas 1.0还是canvas 2.0,mini | mini-native
   */
  handleInit(ctx, rect, canvas, renderer) {
    this.isCanvasInit = true;
    this.ctx = wrapContext(ctx);
    this.renderer = renderer;
    this.canvas = canvas;
    this.updateChart();
  },

  /**
   * canvas派发的事件,转派给graph实例
   */
  handleTouch(e) {
    this.graph && this.graph.emitEvent(e);
  },

  updateChart() {
    const { width, height, pixelRatio } = this.data;

    // 创建F6实例
    this.graph = new F6.TreeGraph({
      context: this.ctx,
      renderer: this.renderer,
      width,
      height,
      pixelRatio,
      fitView: true,
      modes: {
        default: [
          {
            type: 'collapse-expand',
            onChange: function onChange(item, collapsed) {
              const model = item.getModel();
              model.collapsed = collapsed;
              return true;
            },
          },
          'drag-canvas',
          'zoom-canvas',
        ],
      },
      defaultNode: {
        size: 26,
        anchorPoints: [
          [0, 0.5],
          [1, 0.5],
        ],
      },
      defaultEdge: {
        type: 'cubic-horizontal',
      },
      layout: {
        type: 'mindmap',
        direction: 'H',
        getHeight: function getHeight() {
          return 16;
        },
        getWidth: function getWidth() {
          return 16;
        },
        getVGap: function getVGap() {
          return 10;
        },
        getHGap: function getHGap() {
          return 50;
        },
      },
    });
    let centerX = 0;
    this.graph.node(function(node) {
      if (node.id === 'Modeling Methods') {
        centerX = node.x;
      }

      // position的取值(由于ESlint禁止嵌套的三元表达,所以单独提取出来写)
      let position_value = null;
      if (node.children && node.children.length > 0) {
        position_value = 'left';
      } else if (node.x > centerX) position_value = 'right';
      else position_value = 'left';

      return {
        label: node.id,
        labelCfg: {
          offset: 5,
          position: position_value,
        },
      };
    });

    this.graph.data(data);
    this.graph.render();
    this.graph.fitView();
  },
});
index.axml
<f6-canvas
  width="{{width}}"
  height="{{height}}"
  forceMini="{{forceMini}}"
  pixelRatio="{{pixelRatio}}"
  onTouchEvent="handleTouch"
  onInit="handleInit"
></f6-canvas>
微信中
首先安装
npm install @antv/f6-wx -S
@antv/f6-wx 由于微信对npm包不是很友好,所以我们分装了 @antv/f6-wx 帮助用户简化操作。
data.js
同上
index.json
{
  "defaultTitle": "脑图",
  "usingComponents": {
    "f6-canvas": "@antv/f6-wx/canvas/canvas"
  }
}
index.wxml
<f6-canvas
  width="{{width}}"
  height="{{height}}"
  forceMini="{{forceMini}}"
  pixelRatio="{{pixelRatio}}"
  bind:onTouchEvent="handleTouch"
  bind:onInit="handleInit"
></f6-canvas>
index.js
import F6 from '@antv/f6-wx';
import TreeGraph from '@antv/f6-wx/extends/graph/treeGraph';


import data from './data';

/**
 * 脑图-自节点自动两侧分布
 */

Page({
  canvas: null,
  ctx: null,
  renderer: '', // mini、mini-native等,F6需要,标记环境
  isCanvasInit: false, // canvas是否准备好了
  graph: null,

  data: {
    width: 375,
    height: 600,
    pixelRatio: 1,
    forceMini: false,
  },

  onLoad() {
    // 注册自定义树,节点等
    F6.registerGraph('TreeGraph', TreeGraph);

    // 同步获取window的宽高
    const { windowWidth, windowHeight, pixelRatio } = wx.getSystemInfoSync();

    this.setData({
      width: windowWidth,
      height: windowHeight,
      // pixelRatio,
    });
  },

  /**
   * 初始化cnavas回调,缓存获得的context
   * @param {*} ctx 绘图context
   * @param {*} rect 宽高信息
   * @param {*} canvas canvas对象,在render为mini时为null
   * @param {*} renderer 使用canvas 1.0还是canvas 2.0,mini | mini-native
   */
  handleInit(event) {
    const {ctx, rect, canvas, renderer} = event.detail
    this.isCanvasInit = true;
    this.ctx = ctx;
    this.renderer = renderer;
    this.canvas = canvas;
    this.updateChart();
  },

  /**
   * canvas派发的事件,转派给graph实例
   */
  handleTouch(e) {
    this.graph && this.graph.emitEvent(e.detail);
  },

  updateChart() {
    const { width, height, pixelRatio } = this.data;

    // 创建F6实例
    this.graph = new F6.TreeGraph({
      context: this.ctx,
      renderer: this.renderer,
      width,
      height,
      pixelRatio,
      fitView: true,
      modes: {
        default: [
          {
            type: 'collapse-expand',
            onChange: function onChange(item, collapsed) {
              const model = item.getModel();
              model.collapsed = collapsed;
              return true;
            },
          },
          'drag-canvas',
          'zoom-canvas',
        ],
      },
      defaultNode: {
        size: 26,
        anchorPoints: [
          [0, 0.5],
          [1, 0.5],
        ],
      },
      defaultEdge: {
        type: 'cubic-horizontal',
      },
      layout: {
        type: 'mindmap',
        direction: 'H',
        getHeight: function getHeight() {
          return 16;
        },
        getWidth: function getWidth() {
          return 16;
        },
        getVGap: function getVGap() {
          return 10;
        },
        getHGap: function getHGap() {
          return 50;
        },
      },
    });
    let centerX = 0;
    this.graph.node(function(node) {
      if (node.id === 'Modeling Methods') {
        centerX = node.x;
      }

      // position的取值(由于ESlint禁止嵌套的三元表达,所以单独提取出来写)
      let position_value = null;
      if (node.children && node.children.length > 0) {
        position_value = 'left';
      } else if (node.x > centerX) position_value = 'right';
      else position_value = 'left';

      return {
        label: node.id,
        labelCfg: {
          offset: 5,
          position: position_value,
        },
      };
    });

    this.graph.data(data);
    this.graph.render();
    this.graph.fitView();
  },
});
总结
到此这篇关于小程序中如何绘制思维导图的文章就介绍到这了,更多相关小程序绘制思维导图内容请搜索NICE源码以前的文章或继续浏览下面的相关文章希望大家以后多多支持NICE源码!


